


.png)
Disclaimer: Nansen has produced the following report as part of its existing contract for services provided to BNB at the time of publication. While BNB has the right to review and provide feedback to Nansen, Nansen maintains full editorial control over the publication of this report. All views expressed are the independent opinions of Nansen's research analyst(s) who are the author(s) named in this report. This report is intended for informational purposes only and does not serve as investment, financial, professional, or other advice. For more information, please refer to the disclaimer at the end of this report, as well as our Terms of Service.
Overview
BNB Chain (formerly known as Binance Smart Chain or ‘BSC’) was launched in September 2020 to provide an alternative smart contract platform to the increasingly expensive Ethereum mainnet. It is an independent blockchain that works on a Proof of Staked Authority (PoSA) consensus mechanism (where participants stake BNB to become validators). The chain is also compatible with the Ethereum Virtual Machine (EVM), meaning it could leverage pre-existing Ethereum tooling which contributed to its enormous growth.
BNB was created as a scalable infrastructure to handle a large number of low-cost DeFi transactions without compromising speed. It also aims to deliver programmability and smart contracts to developers who want to launch their tokens on the BNB Chain network.
To date, there are thousands of projects on the BNB Chain, with notable mentions of Era7, SecondLive, Tiny World and MOBOX. Additionally, PancakeSwap continues to be the most used dApp on the network in Q2 2022.
Among all the blockchains, BNB Chain is still currently the most used chain in terms of transactions and unique wallet addresses due to its low transaction costs.
Key Developments: Q2 2022
- BNB Chain’s $1b ecosystem fund continued to fund numerous projects to grow out and improve the ecosystem.
- Binance Bridge 2.0 was introduced on Apr 27 which enables users to bridge assets from any blockchain to BNB Chain.
- BNB Smart Chain Mainnet went through upgrades of Descartes (Apr 1), Euler(Jun 9).
- BNB Beacon Chain went open-sourced on Jun 17.
- In June, BNB launched its 5th ‘Most Valuable Builder’ program. This is named ‘MVB V: Uncharted Territory’.
- Nansen added analytic support for BNB Chain NFT on Jun 13.
- Launch of BNB Sidechain (Jun 2).
- Introduction of more validators (21 to 41) on May 31.
BNB Ecosystem
The ecosystem of BNB had grown to include more than 1,400 dApps in Q2, with popular ones like PancakeSwap, Venus, Alpaca Finance, SecondLive, Era7, Mobox and Tiny World. The $1b ecosystem fund and recent $500m investment fund is expected to help the ecosystem grow and expand in spite of the current market environment.

Nansen Data
Daily Transactions

As can be seen in the graph above, both transactions and gas had continued their decline in Q2 2022 as general on-chain activity decreased whilst the market continued to be bearish. The sudden spike between the 11th and 12th of May was most likely the spillover effect caused by the de-pegging of UST and collapse of LUNA.
Transactions: Ethereum vs BNB Chain

BNB Chain is the most active smart contract blockchain by number of transactions, even dwarfing Ethereum. Although transactions had fallen slightly over Q2 (which can be explained by general reduction in on-chain activity), it remained ~3-6x that of Ethereum, peaking at 9.8 million transactions during the UST de-pegging event of May 12. Although some of this could be attributed to bot activity, BNB Chain remained a popular chain with retail who have been priced out of Ethereum.
Daily Gas Paid vs Ethereum

The data above shows that total gas paid on the BNB chain continued to be significantly lower compared to Ethereum. Despite being cheaper and faster to conduct transactions on the BNB chain, the network is also more centralized than Ethereum with only 21 active validators. Hence, the BNB Chain Developer Community introduced the BEP-131 proposal that aimed to incentivise and increase the number of validators for further decentralization on the BNB Chain. Besides that, the daily gas paid in USD for both chains continued to decline at the end of the last quarter (BNB is shown in detail in the next chart).

Additionally, it is worth noting that BNB continued to have higher daily transactions compared to Ethereum while maintaining significantly lower daily gas fees paid - averaging $700k for BNB and $5m for ETH in the final week of the quarter.

As mentioned previously, PancakeSwap continues to dominate the log occurrences, amounting to 20% of all transactions on the chain. Other notable mentions in Q2 would be Era7, SecondLive, MOBOX and Tiny World, Play-to-Earn games that were popular this quarter. Additionally, the ‘Unknown’ label at 33% refers to the sum of all untagged entities at Nansen, rather than any single unknown entity.
Stablecoins: Daily On-Chain Volume

The Daily Stablecoin transactions volume in a chain is another important metric that can be used to assess the activity and adoption taking place in that network. As the adoption of a chain grows, so does the amount of the daily on-chain stablecoin volume, as stablecoins are a fundamental component that facilitates token transactions.
The graph above shows the daily on-chain volume for USDT, DAI, USDC, BUSD and TrueUSD on the BNB chain. At the start of the quarter, daily on-chain volume saw significant variations for the different stablecoins available on the chain. USDT and BUSD accounted for the majority of the activity, followed by USDC, DAI and True USD. The majority of stablecoin volumes peaked on May 12th with USDT reaching $7.4b, due to the de-pegging of UST.
Towards the end of the quarter, USDT, BUSD and USDC were relatively close in daily on-chain volume, with USDT volume dropping 87.29% since its peak, while BUSD and USDC volumes dropped 80.93% and 79% respectively. It is also worth noting that TrueUSD had a peak of $1.4b at the start of June but ended the quarter with only roughly $1m, dropping by more than 99.93%.
Stablecoins: Daily Active Senders
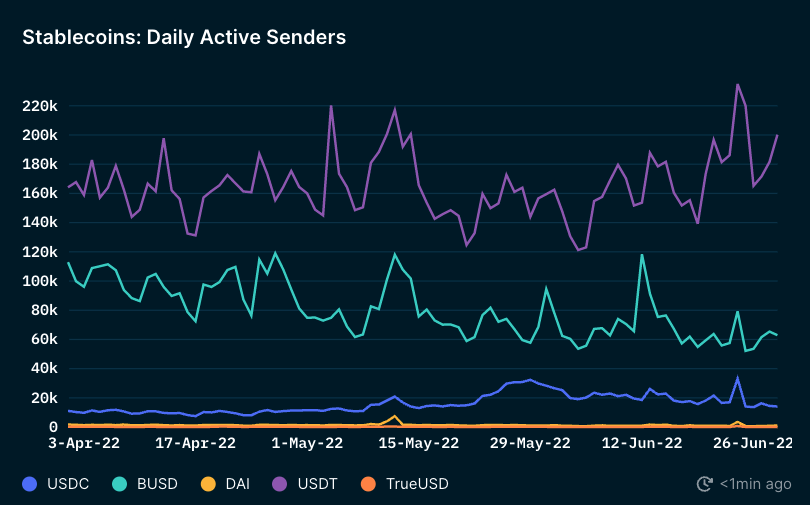
By further analyzing the Daily Active Senders, the stablecoin that was transacted the most on BNB Chain was USDT, followed by BUSD. There was a significant gap in the number of daily active senders between these two stablecoins and all the other stablecoins on the chain. USDT continued to dominate over BUSD since Q1 with the gap widening towards the end of Q2. BUSD saw its user base decrease from a peak of 120k daily active senders to about 60k. On the other hand, the number of daily active senders for USDT continued to climb to a peak of 235k in late June. Besides that, DAI and TrueUSD continued to stay constant this quarter with the number of daily active senders for DAI continuing to hover around 1,200 and below 200 for TrueUSD.
Ethereum Smart Money Segments on BNB Chain

The chart above shows a breakdown of the Smart money addresses that are active on the BNB Chain as a proportion of the segments in Ethereum addresses. They have been categorized based on the type of smart money. If you are not yet familiar or need a refresher on what the different labels mean, please follow this link here for the specific definitions.
The majority of the smart money segments continued to fall under stakers or liquidity providers (First Mover Staking, First Mover LP, Smarter LP, Smart LP), as this can be explained by the higher APYs available on the chain for such activities. It is then followed by the NFT segments given the continued high growth of NFT activity on the chain since Q1. Funds were a smaller segment with 23.2% overlap.
Total Value Locked

Based on the TVL table above, TVL declined further this quarter as the crypto market faced a general downward trend. However, it should be mentioned that the % decrease in TVL was lower for BNB at 58.3% compared to Ethereum’s decrease of 65.5%.
Conclusion
In spite of the market downturn, BNB remained as the most used chain by daily transactions due to its low gas fees. Throughout Q2, BNB also actively funded new projects using its $1b ecosystem fund to improve the ecosystem despite market conditions. With its massive ecosystem of dApps and low transaction fees, BNB chain continued to be actively used by users. Q3 will be exciting with the introduction of BNB liquid staking, along with the plans for BEP-126: Fast Finality Mechanism on BNB Beacon Chain which is expected to reduce transaction finality time.
.png)